KlarfView is a “mini-application” that uses GNUPLOT to create PNG image files from KLARF files.
Simple in concept, yet powerful in its uses, KlarfView can be used for:
- Visual data mining to determine similar defect signatures among many maps.
From there, you can determine common levels, devices, technologies and process equipment to drill down to the source of the signatures. - Automatic defect monitoring.
Defect map images can be generated automatically on a daily basis & stored locally for review of recent scan data, making it easier to come up to speed on recent events. - Unlike the typical expensive, bloated applications, KlarfView gives you a broader view of map galleries.
The other software providers force you to view wafer maps their way, with limited views.
It is nearly impossible to get a view of the big picture, or do real data mining.
KlarfView avoids the trap of limited-use map viewers, because Windows already provides gallery capabilities using “thumbnail view” in explorer.
With KlarfView you are free to focus on real data mining.
Feature Summary
Create maps of patterned and non-patterned wafers for any klarf file < ver 1.8. (Ver 1.8 support will be in a later release.)
Run the program like any typical application – you will be able to select klarf files to process.
Run the program using a batch file – just set the parameters and run.
Useful for automated applications.
Extremely fast processing – typical processing speeds are less than a second per klarf file.
Rich set of features that you control in an INI file or a batch file:
- Set input klarf file name(s) using wildcards.
- Set output image folder name (where the images will go).
- Set filter on which klarf files to process based on minimum and maximum number of defects, or maximum file size limit.
- Set order of the file name fields.
The image file names contain “Lot Waf Step Setup Slot”.
You can rearrange the order of this list to adjust the order of the file names.
This is useful for sorting and filtering in Windows Explorer. - Define how the wafer will be displayed. Notch down, or as scanned.
- Define if a title will or will not be shown on the map. The title contains lot id, wafer id, step id and slot number.
- Define which field in the defect list of the klarf file to color the defects by.
The colors, shapes and sizes of the defects are defined in an editable text file.
(Note: coloring by defect size bins is not supported yet.) - Define if a legend will or will not be displayed.
The legend will only be displayed if defects are colored by any of the fields. - Define options for how the legend will be displayed using GNUPLOT “key” settings.
- Full control over wafer and die line width, type and color.
Running The Program
Option 1: Run by double-clicking on the KlarfView Icon
Just double-click on the KlarfView icon to start the program.
You will be prompted to select the klarf files you want to process.
That’s it! All files will be processed using the settings in the INI file.
Note: If you have defined klarf files to process in the INI file,
you will not be prompted to select klarf files.
Option 2: Run using the kv.bat file (located in the install folder)
Just set your options in the batch file, then run the file in an open command window.
You can use this option to automate map creation.
For either option, you can create simple maps as seen in figures 1 – 4, or maps colored by defect classifications (figs 5 – 6), or cluster number (figs 7 – 8).
 |
 |
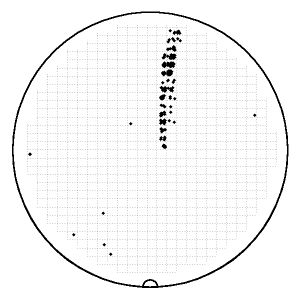
Figure 1: Example of a patterned wafer map. |
Figure 2: Example of a patterned wafer map. |
 |
 |
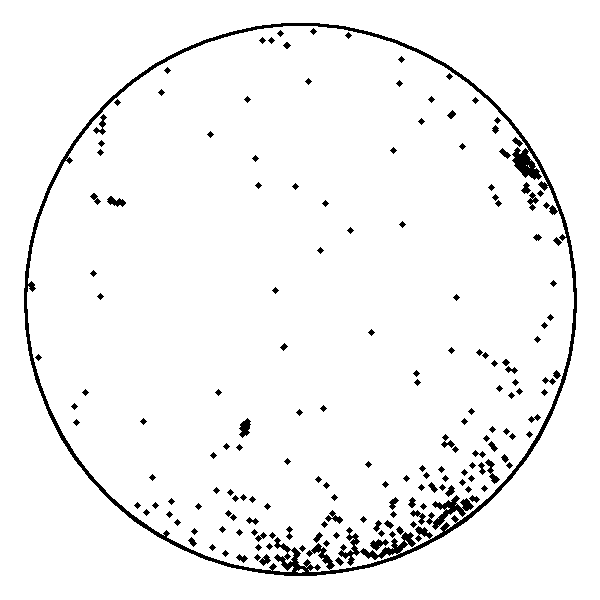
Figure 3: Example of a unpatterned wafer map. |
Figure 4: Example of a unpatterned wafer map. |
 |
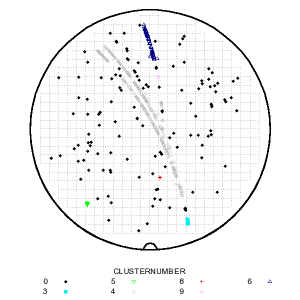 |
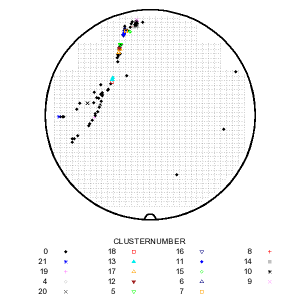
Figure 5: Defects colored by cluster number. |
Figure 6: Defects colored by cluster number. |
 |
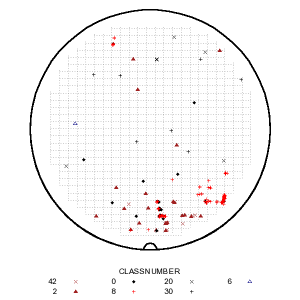 |
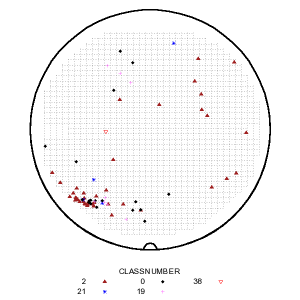
Figure 7: Defects colored by class number. |
Figure 8: Defects colored by class number. |
The colors are controlled using the tab-delimited text file, “colorbysettings.txt”, as shown in figure 9.
All settings use standard Gnuplot settings.
Consult Gnuplot documentation for more information about options to set point colors, types and sizes.
The fields in this file are:
- Number: A unique number for each row. Not used by the program. For reference only.
- Ignore: Put any character here for the program to ignore the row.
- Group: The name of the column of data to be used for coloring. The names correspond exactly to how they are listed in the klarf file.
- Value: The value of the parameter. Example: class codes 0, 1, 2, etc.
- Type: The point type to be used for this value. Point types are documented in the Gnuplot manual.
- Color: The point color to be used for this value. Point colors are documented in the Gnuplot manual.
- Size: The point size to be used for this value. Point sizes are documented in the Gnuplot manual.
Point types, and their corresponding numbers are shown in figure 10 below.
You can find the original for this chart, plus more information about Gnuplot in
Wikipedia.
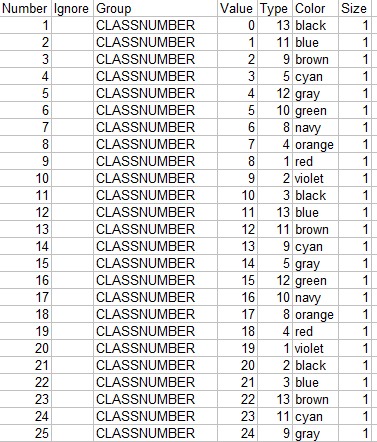 |
Figure 9: Set point colors using the “Colorsettings.txt” file. |
 Figure 10: Gnuplot point types and their numbers. |
How To View the Map Images
Since Windows 2000, there has been a way to view images as galleries through the file Explorer.
Windows Vista has built-in options to give you control over the size of the images in the gallery view.
But for 2000 and XP, you need to download the
“TweakUI.exe”
program to adjust the image sizes to your liking.
You can find an explaination on how to adjust the thumnail sizes in TweakUI at the
TechRepublic.
If you are running 2000 or XP, just download and install TweakUI and set up the thumbnail image size in the Explorer options.
After running KlarfView, open the folder containing the wafer map images (default is “C:\Map_Images\”).
You will see the gallery like the one shown in figure 11. The defect signatures are clearly seen.
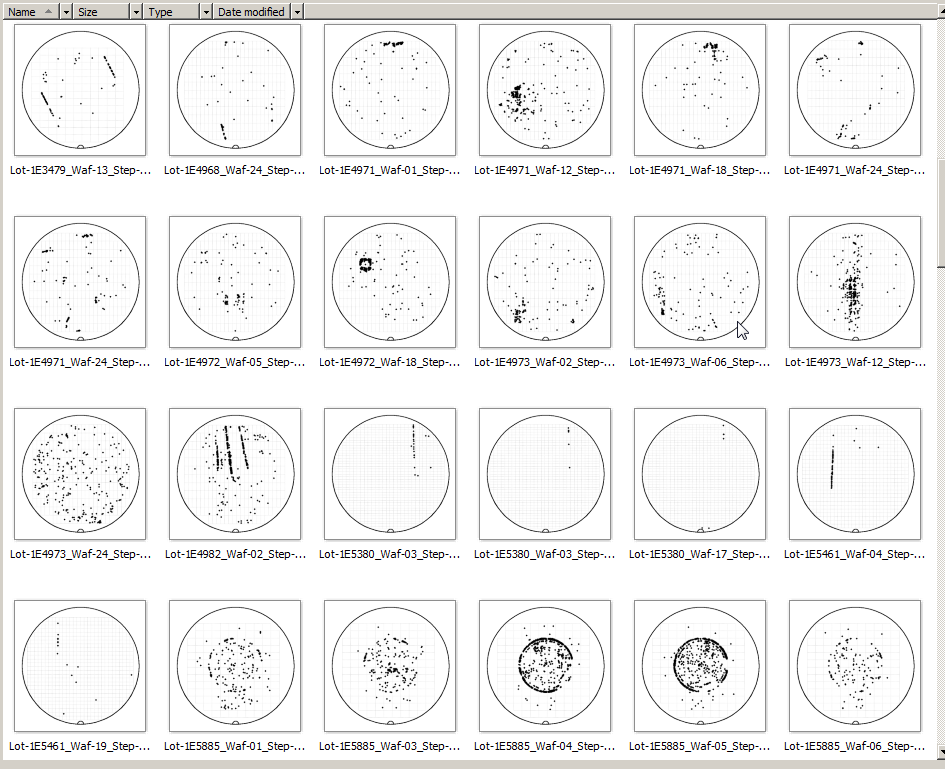 |
Figure 11: Example of wafer map gallery using Windows Thumbnail View. |
Uses
Reports
Generate images for all wafers inspected within a period of time.
For example, generate maps each morning to display all wafers inspected for the last 24hrs.
You can get a quick idea of any issue that may have come up in the past day.
Visual Data Mining
Use map galleries using maps generated by KlarfView to look for repeating signatures over several wafers or groups of wafers.
Examples can be seen in figure 12.
The maps in the boxes have similar-looking signatures.
All you need to do is to note the lot id, step, and so on, then find the common process tools these wafers ran on.
In effect, you are doing defect signature analysis without the need for a spatial signature “DSSA” program.
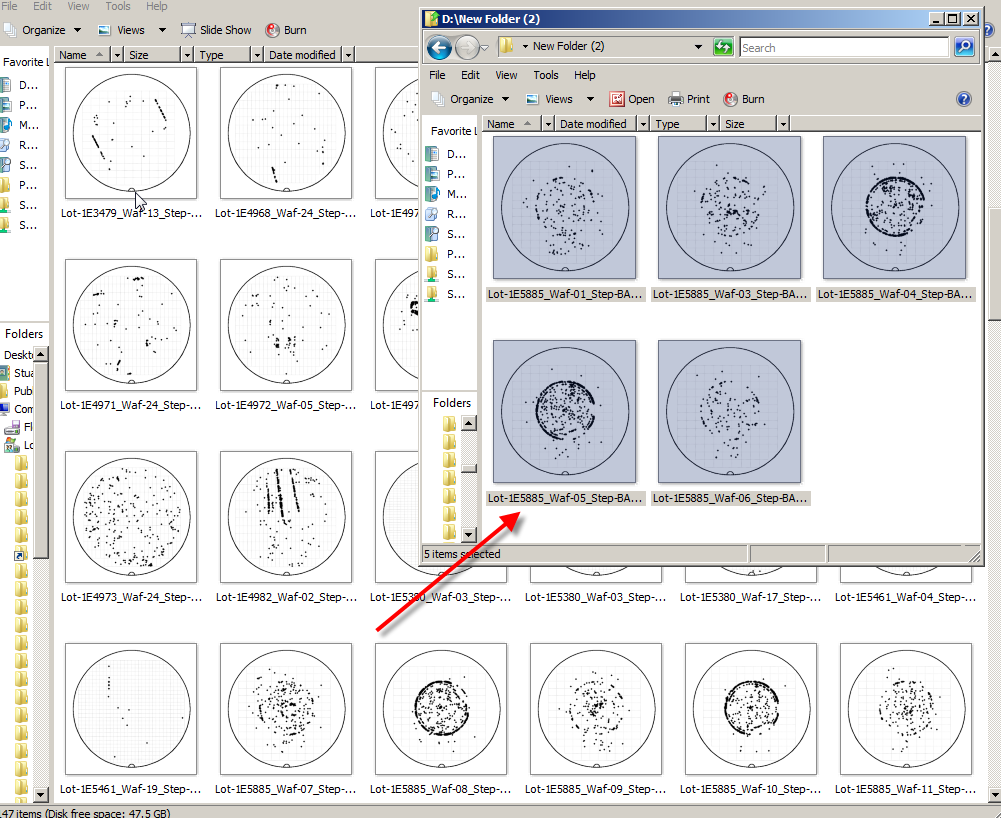 |
Figure 12: Maps with similar signatures can be collected into folders. |

Can no longer download the installer as google drive says it has a virus. It says “Only the owner is allowed to download infected files”.
Try this link: https://www.dropbox.com/s/n9l3i7r7t9icaxm/KlarfView_Install.zip?dl=0
I don’t know why Google has a problem with Java programs. At some point, I may just rewrite the entire program in Visual Studio. But that’s very low on my list of priorities at this time.
Let me know if this link works for you.
That worked great! Thank you very much.